
DEXA Body Composition Scan
Discover how Melior’s unique phenotypic screening platforms can uncover the untapped value of your candidate therapeutic
Obesity is a condition of pandemic proportions in the modern world. A myriad of conditions ranging from cardiovascular disease, type-2 diabetes, cancer, and even depression have been linked to obesity (Bloom SR, 2008).
Research into the mechanisms and treatment of obesity is an ongoing area of interest to many in the pharmaceutical and academic communities. Animal models have proven useful in studying the effects of compounds on diet-induced obesity (DIO) (Hildebrand AL, 2003; Levin BE, 2000).
Dual-energy Xray absorptiometry (DEXA) is an instrument that uses X-rays with different wavelengths to quantitate a number of parameters associated with overall body composition such as bone mineral density, bone mass, lean tissue mass, fat tissue mass, and others.
In this study we used a high-fat diet induced obesity mouse model to illustrate the use of DEXA. Fat mass (adipose tissue) and lean mass (largely muscle) were assessed using DEXA in both standard and high-fat diet fed mice. At Melior, this assay serves as a platform for a number of additional acute and chronic disorders consistent with diet-induced obesity changes in humans.
Ready to get started or looking for a custom model?
Contact us today for more information about our bespoke research models and to discuss how we can help you answer your unique research questions.
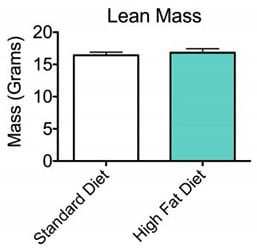
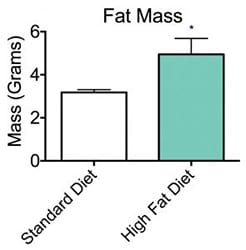
CD-1 male mice were fed either a high fat diet or standard diet for 28 days. DEXA scans performed upon termination of study. Mice on High Fat Diet showed elevated fat mass compared to standard diet fed mice, yet there was no significant difference in lean mass between groups. Data are ± SEM; *p<0.05 (N=8).

Interested in running a DEXA Body Composition Scan study?

If you are interested in learning more about the DEXA – Body Composition Scan, please contact us to start the conversation today!