
Cortical EEG Frequency
Discover how Melior’s unique phenotypic screening platforms can uncover the untapped value of your candidate therapeutic
Cortical EEG activity can be recorded from chronically implanted rats and mice, and evaluated as a function of frequency to characterize or compare the effects of psychoactive drugs such as benzodiazepines, NMDA antagonists, etc.
EEG activity (0.03 – 100 Hz) is recorded for 24 h or more, and evaluated over discrete frequency ranges and time periods depending on the observed drug effects.
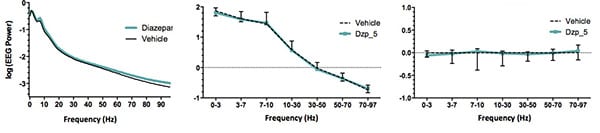
Raw EEG data is analyzed by Fourier analysis to derive EEG power as a function of frequency. Raw data (left) shows typical reduction in power with frequency (average over 90 min prior to dosing). Middle graph shows the same data subdivided into 7 discrete frequency ranges and normalized across animals. Right-most graph is normalized data with the vehicle group subtracted showing no pre-dosing difference between groups.
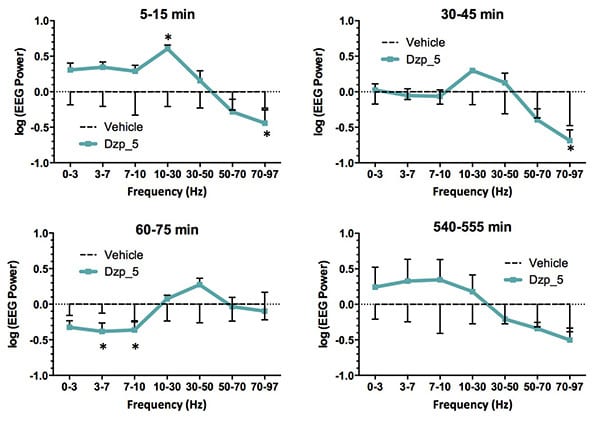
Graphs above are vehicle-subtracted curves of EEG power at the indicated times after treatment with diazepam (5mg/kg IV) in rats. Note the initial increase in low frequency power at 5 minutes, reversal at 60 minutes and reversal again at 540 minutes. Also note the general reciprocity of effects below 30 Hz (where increased power is associated with sleep or sedation) versus above 30 Hz, which is associated with wake or cognition.
This video represents a 3D view of EEG power as a function of frequency and time relative to dosing (-110 min = average over 90 min prior to dosing). Drug effects can be compared using 3-factor ANOVA
 Interested in evaluating Cortical EEG Frequency in mice or rats?
If you are interested in learning more about the Cortical EEG Frequency, please contact us to start the conversation today!