Melior Discovery in vivo models of Neurophysiology
in vivo Efficacy: Animal Models
Melior is a leading contract research provider of preclinical in vivo pharmacology services using rat and mouse models of Neurophysiology.
Neurophysiology
One of Melior’s greatest strengths consists of highly sophisticated electrophysiological evaluation of CNS function in rodents. This capability spans the range from routine peripheral nerve recording and chronic EEG evaluationof sleep wake architecture to single unit recording in the sub thalamic nucleus. The electrophysiology models and techniques listed below are applicable to many neurological diseases such as neurodegeneration (including neuropathy, axonopathy, myopathy, and motor paralysis), insomnia and sleep disorders, seizures, cognition, and stress.
EEG Frequency and Analyses
- Cortical EEG Frequency
- Pro-and Anti-Convulsant Evaluation
- Sleep/Wake and Motor Activity
- Status Epilepticus Epilepsy Model
Evoked Potentials
Reflex Response
Single Unit Recording
EEG Pro- and Anti-Convulsant Evaluation
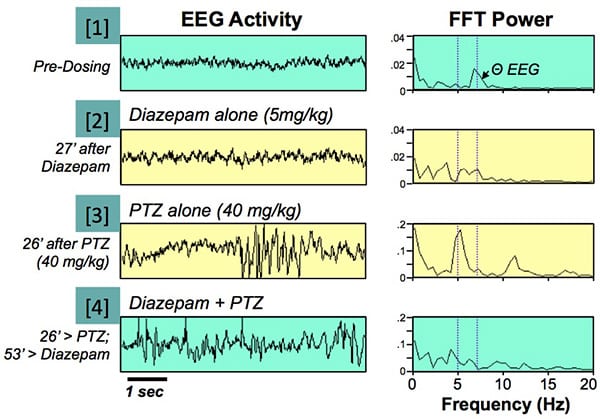
Pro- or anti-convulsant activity can be evaluated using EEG power analysis and can be more sensitive than models utilizing chemical or electrical stimuluation and behavioral outcome measures. For example, quantitative anti-convulsant activity can be evaluated using sub-convulsant doses of PTZ that produce characteristic EEG frequency changes that can be quantitatively analyzed for several hours.
EEG Frequency Time Course After PTZ; Drug Treatment vs Vehicle:
Sub-convulsant dose of PTZ increases low-frequency EEG power at 5 Hz for several hours after administration. [1] Normal waking EEG pre-dosing. Note peak in FFT record at 7-8 Hz corresponding to theta band. [2] “Treatment” (5mg/kg) alone has little effect on EEG (27 minutes post dosing). [3] This animal was treated with Vehicle, then 27 minutes later given PTZ (40mg/kg). EEG recorded 26 minutes later shows periodic bursting which produced a significant increase in FFT amplitude at 5 Hz, distinct from theta EEG (note 5x decrease in FFT scale). [4] Same animal as panel [2] also received PTZ at the same time as animal in panel [3]. In this case, Treatment almost completely blocked PTZ-induced burstin.
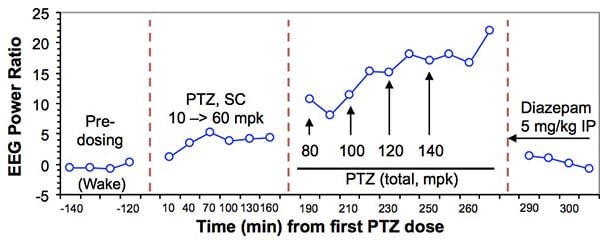
Suppression of PTZ Bursting in Mice by Drug Treatment:
EEG bursting can be induced in mice by dose-escalation of PTZ. The graph above shows he increase in EEG power at 4-6 Hz over a period of 280 minutes during successive administration of PTZ doses totaling 140 mg/kg. “Treatment” (5 mg/kg) was then administered and within minutes suppressed the bursting.
See Additional Data on EEG Pro- and Anti-Convulsant Evaluation
Model of Status Epilepticus
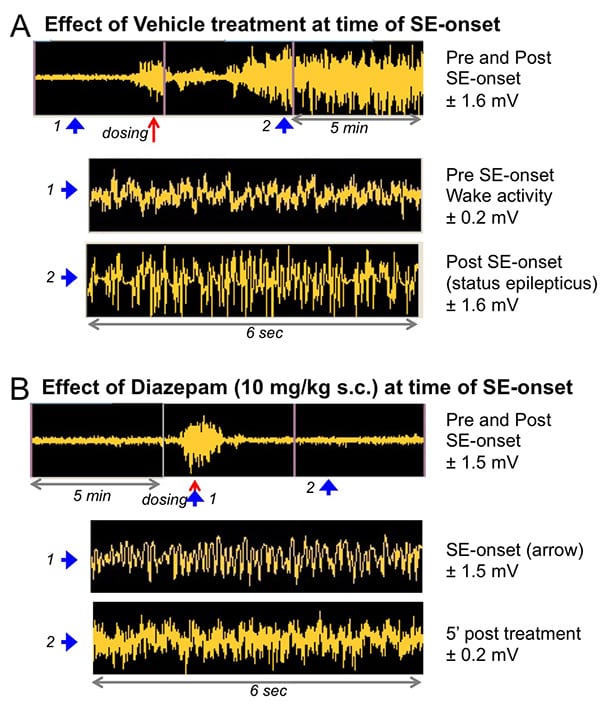
Status epilepticus (SE) is a form of epileptic seizure that is resistant to treatment with standard anti-epileptic drugs, in particular when they are administered more than 1 h post onset. Abrogation of the seizures in that case is very difficult, requiring days or weeks of treatment, and may ultimately fail. At Melior we can quantitatively evaluate treatment effects using EEG recording across a wide frequency range (0.3-96 Hz).
The figure below shows a typical example of an animal before and after initiating SE. The EEG activity is increased across all frequencies by over 10 fold. Treatment with vehicle (A) at the onset of SE has no effect, and seizure activity can continue for several hours. Treatment with 10 mg/kg s.c. “Compound” at the onset of SE (B) rapidly blocks seizure activity, returning EEG amplitudes to normal values.
Cortical EEG Frequency
Cortical EEG activity can be recorded from chronically implanted rats and mice and evaluated as a function of frequency to characterize or compare effects of psychoactive drugs. EEG activity (0.03 – 100 Hz) is recorded for 24 hours or more, and evaluated over discrete frequency ranges and time periods depending on the observed drug effects.
Baseline EEG:
Raw EEG data is analyzed by Fourier analysis to derive EEG power as a function of frequency. Raw data (left) shows typical reduction in power with frequency (average over 90 minutes prior to dosing). Middle graph shows the same data subdivided into 7 discrete frequency ranges and normalized across animals. Right graph is normalized data with Vehicle group subtracted showing no pre-dosing difference between groups.
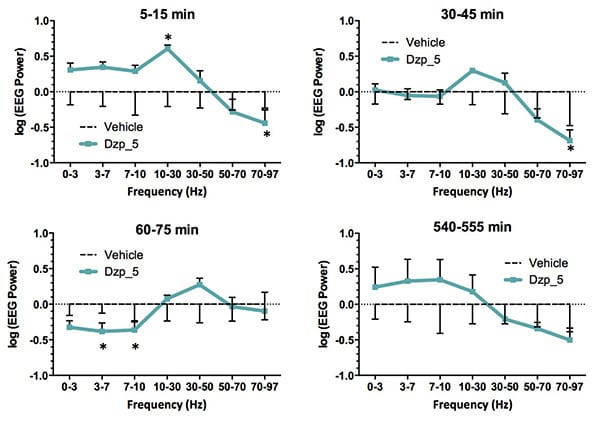
EEG power after treatment with compound (”Treatment”):
Graphs above are vehicle-subtracted curves of EEG power at indicated times after treatment with compound (5mg/kg IV) in rats. Note the initial increase in low frequency power at 5 minutes, reversal at 60 minutes and reversal again at 540 minutes. Also note the general reciprocity of effects below 30 Hz (where increased power is associated with sleep or sedation) versus above 30 Hz, which is associated with wake or cognition.
Cortical Sensory Evoked Potentials
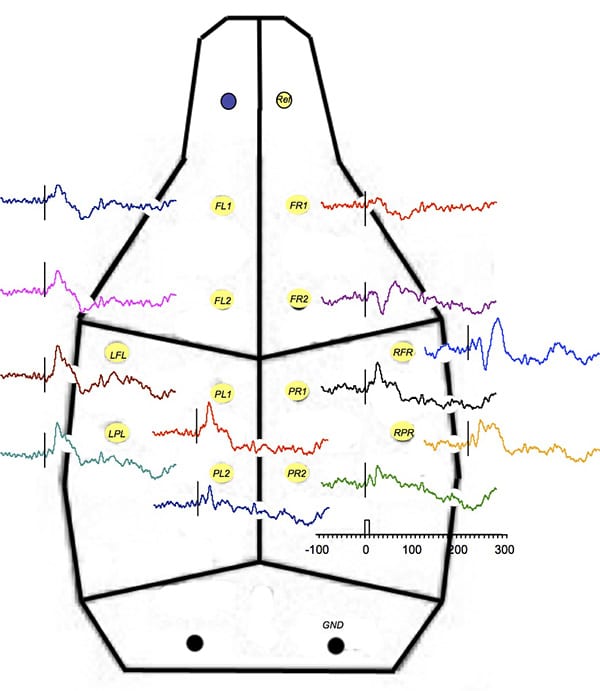
Somatosensory (tibial n., auditory, etc.) evoked or event-related potentials can be recorded at various locations in the brains of rats and mice using surface or depth electrodes. These potentials can be used to monitor the effects of drugs on attentional and cognitive functions. Auditory evoked potentials have been recorded from the hippocampus, for example, to evaluate the effects of drugs on attention. A topographic map of EEG responses to auditory clicks shows functional localization of responses across the cortex.
Auditory Evoked Potentials: Topographic Mapping:
The figure above shows average evoked responses from a rat implanted with 12 separate chronic supra-dural electrodes using a common reference over the olfactory bulb. Responses to auditory clicks (75 dB, 10 msec, 3 kHz, 11 sec ISI, n=32) from a speaker above the animal are shown adjacent to electrode position. The largest response, at location “RFR” (right frontoparietal region), was above the auditory cortex. Note the different shapes of potentials around this location indicating localized surface responses. Time scale at the bottom in msec; tone at time 0.
Get More Information on Melior’s Diabetes models and theraTRACE® Phenotypic Screening Platform:


