
mHFD-NASH Model with Enhanced Fibrosis
Discover how Melior’s unique phenotypic screening platforms can uncover the untapped value of your candidate therapeutic
Non-alcoholic steatohepatitis (NASH) is a hepatic manifestation of metabolic syndrome that can progress to liver cirrhosis. It afflicts as many as 12% of indiviuals in the U.S.[1]
Melior has established a NASH animal model with higher face validity qualities and that we believe is more clinically translatable than other popular models [2]. Our NASH model exhibits pronounced obesity, dyslipidemia, insulin resistance, accompanied by liver steatosis, inflammation, fibrosis and hepatic triglyceride content [3]. In this way, we believe that this model closely mimics most features of human NASH and may represent the most relevant rodent model of NASH.
We have established an enhanced fibrosos verion of our model by strengthening the fibrosis severity using a CCl4exposure paradigm comparable to that used by Tsuchida et al, 2018 (4).
Importantly, we have validated this model with the PPAR alpha agonist fenofibrate, and the clinical proven NASH candidate, obeticholic acid (OCA; an FXR agonist).
For a somewhat milder version of this model without chemical intervention see Standard mHFD NASH Model
Below are data comparing a standard diet (SD) with our modified diet (MD)-treated animals on vehicle, fenofibrate or OCA (N=9-12).

Bodyweight Changes. Bodyweights of all mice were measured weekly. Compared to Normal chow-fed mice, MD-Vehicle mice had significantly higher bodyweights. Compared to MD-vehicle mice, Fenofibrate and OCA significantly reduced the bodyweight after 8-week treatment. All NASH mice/groups shared similar bodyweights before the initiation of drug treatment. Data are mean±SEM and analyzed by Unpaired T-tests as applicable (*p<0.05, **p<0.01, ***p<0.001, vs. MD-Vehicle; #### p<0.0001, vs. SD-Vehicle). MD=NASH model SD=standard diet control.
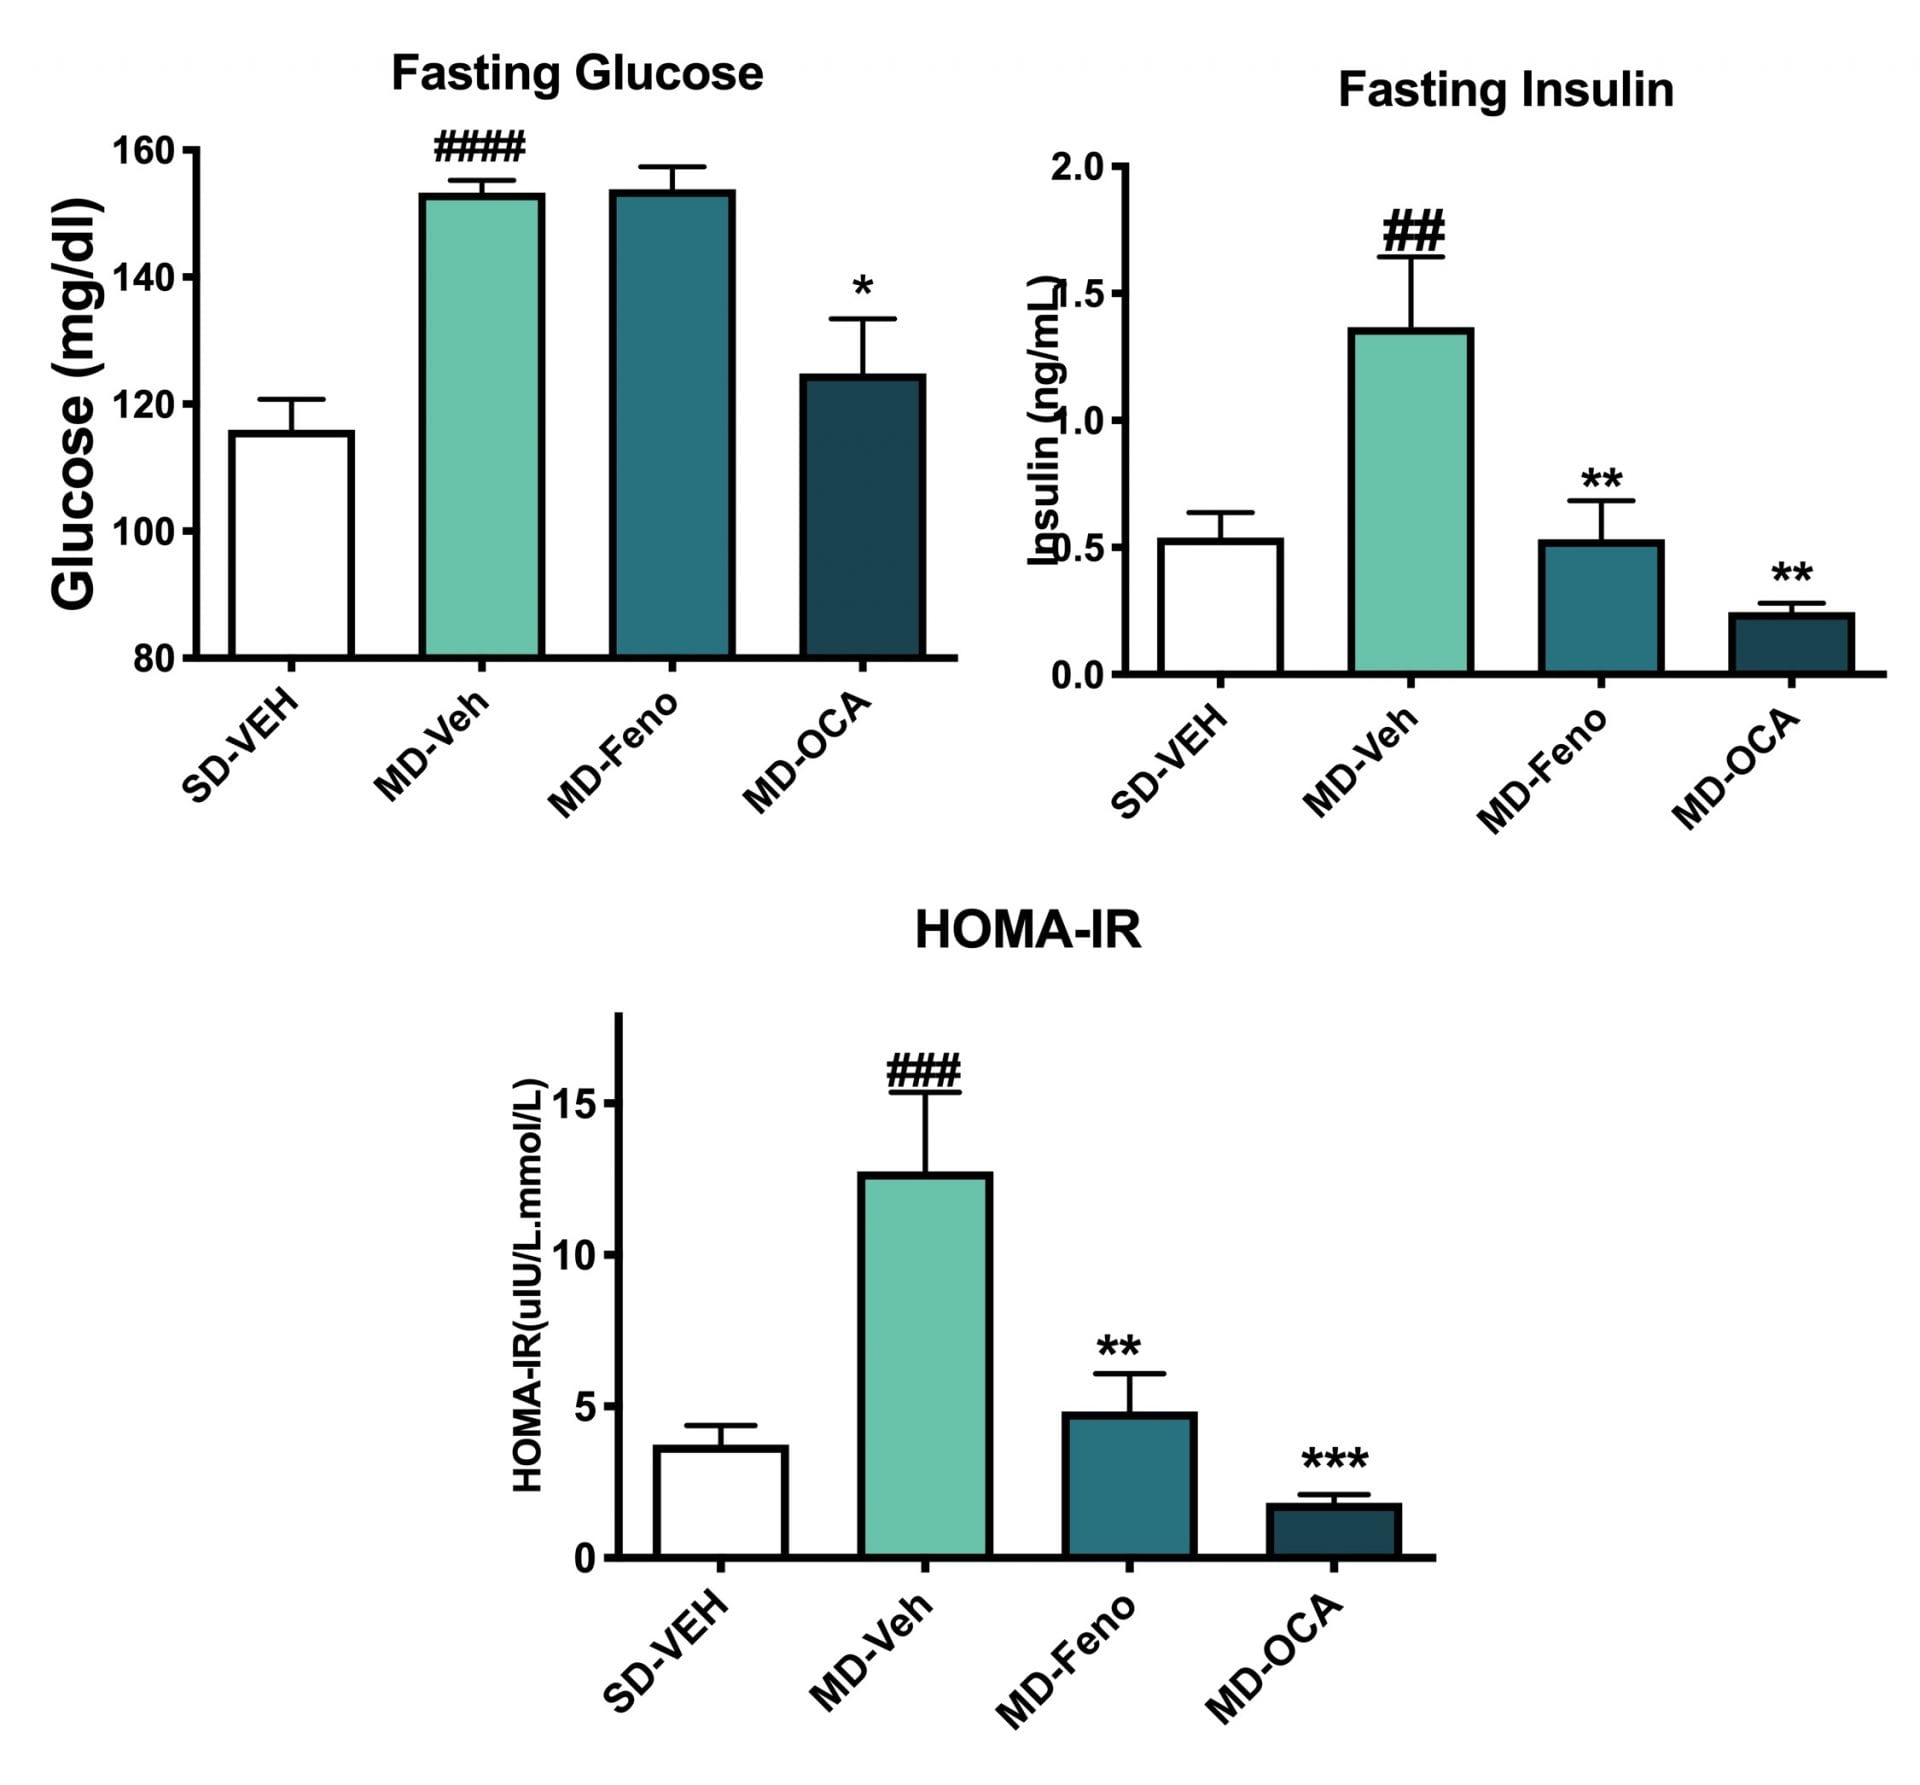
Insulin Sensitivity Changes. Terminal fasting insulin and glucose were assessed. The HOMA-IR was calculated. Compared to Normal chow-fed mice, MD-fed Vehicle mice had significantly insulin resistance. Compared to MD-vehicle mice, Fenofibrate and OCA, significantly improved the inulin sensitivity. Data are mean±SEM and analyzed by Unpaired T-tests as applicable (*p<0.05,**p<0.01,***p<0.001****p<0.0001, vs. MD-Vehicle; #p<0.05, ###p<0.001,#### p<0.0001, vs. SD-Vehicle).
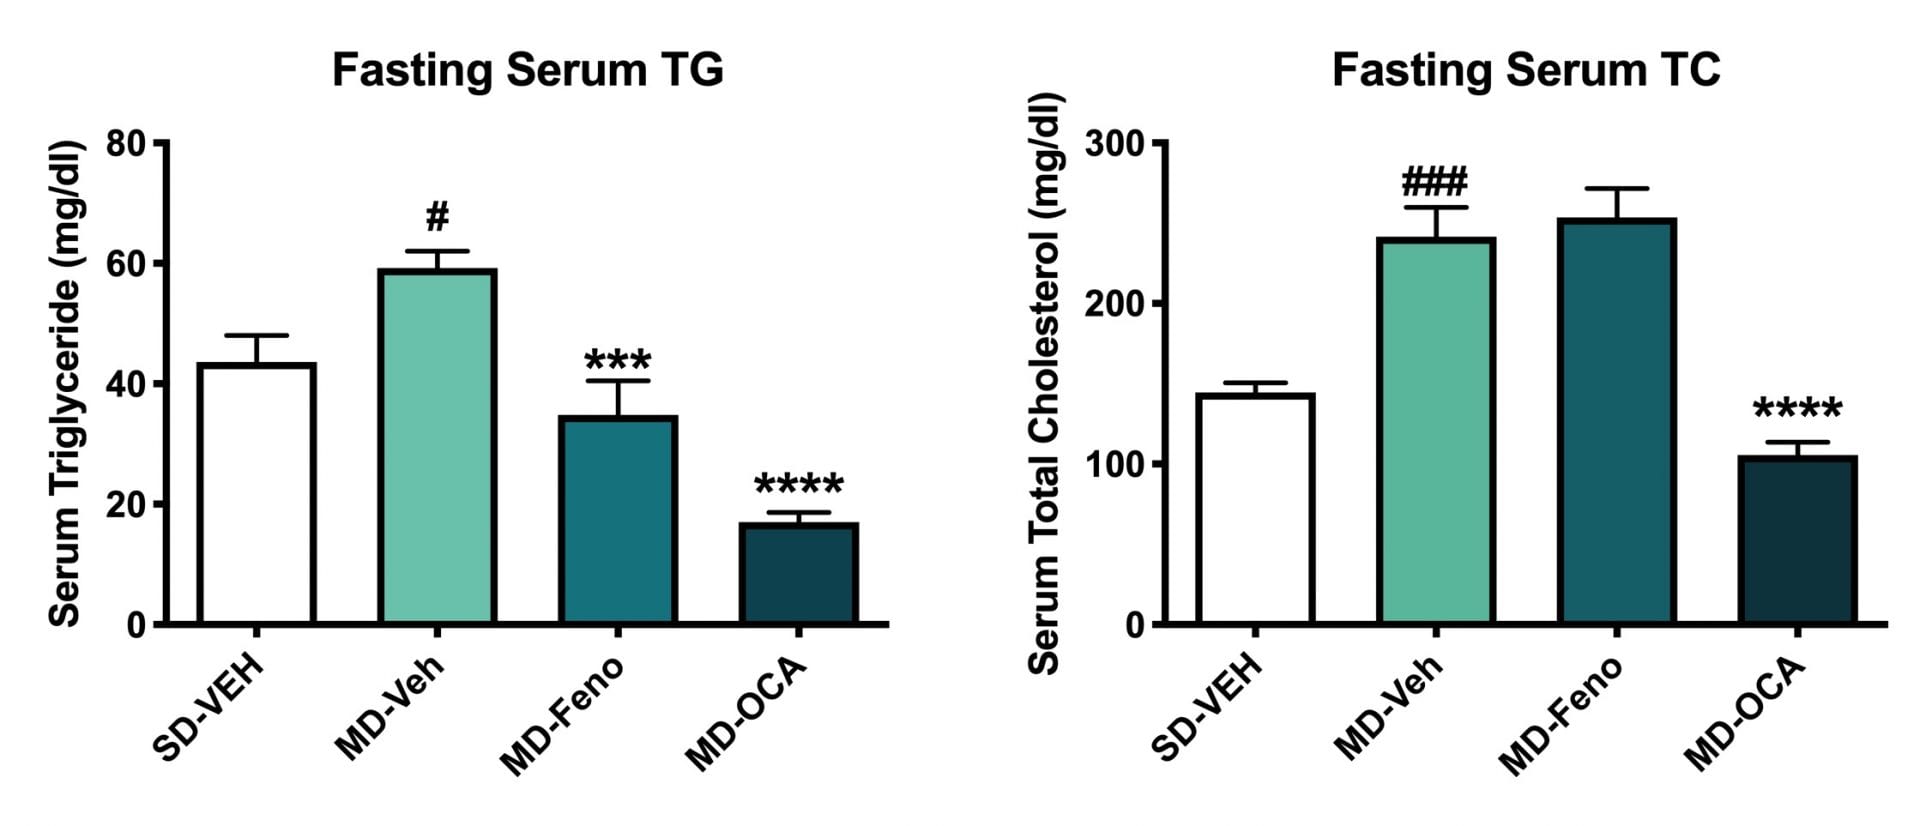
Terminal Serum Lipids (Triglyceride and Total Cholesertol). Fasting serum TC and TG of all mice were measured at the end of study. Compared to Normal chow-fed mice, MD- Vehicle mice had significantly higher serum TG and TC. Compared to MD-vehicle mice, Fenofibrate and OCA significantly reduced the serum TG levels. In addition, OCA significantly reduced serum TC levels. Data are mean±SEM and analyzed by Unpaired T-tests as applicable (*p<0.05, **p<0.01,***p<0.001****p<0.0001, vs. MD-Vehicle; ###p<0.001,# p<0.05, vs. SD-Vehicle).
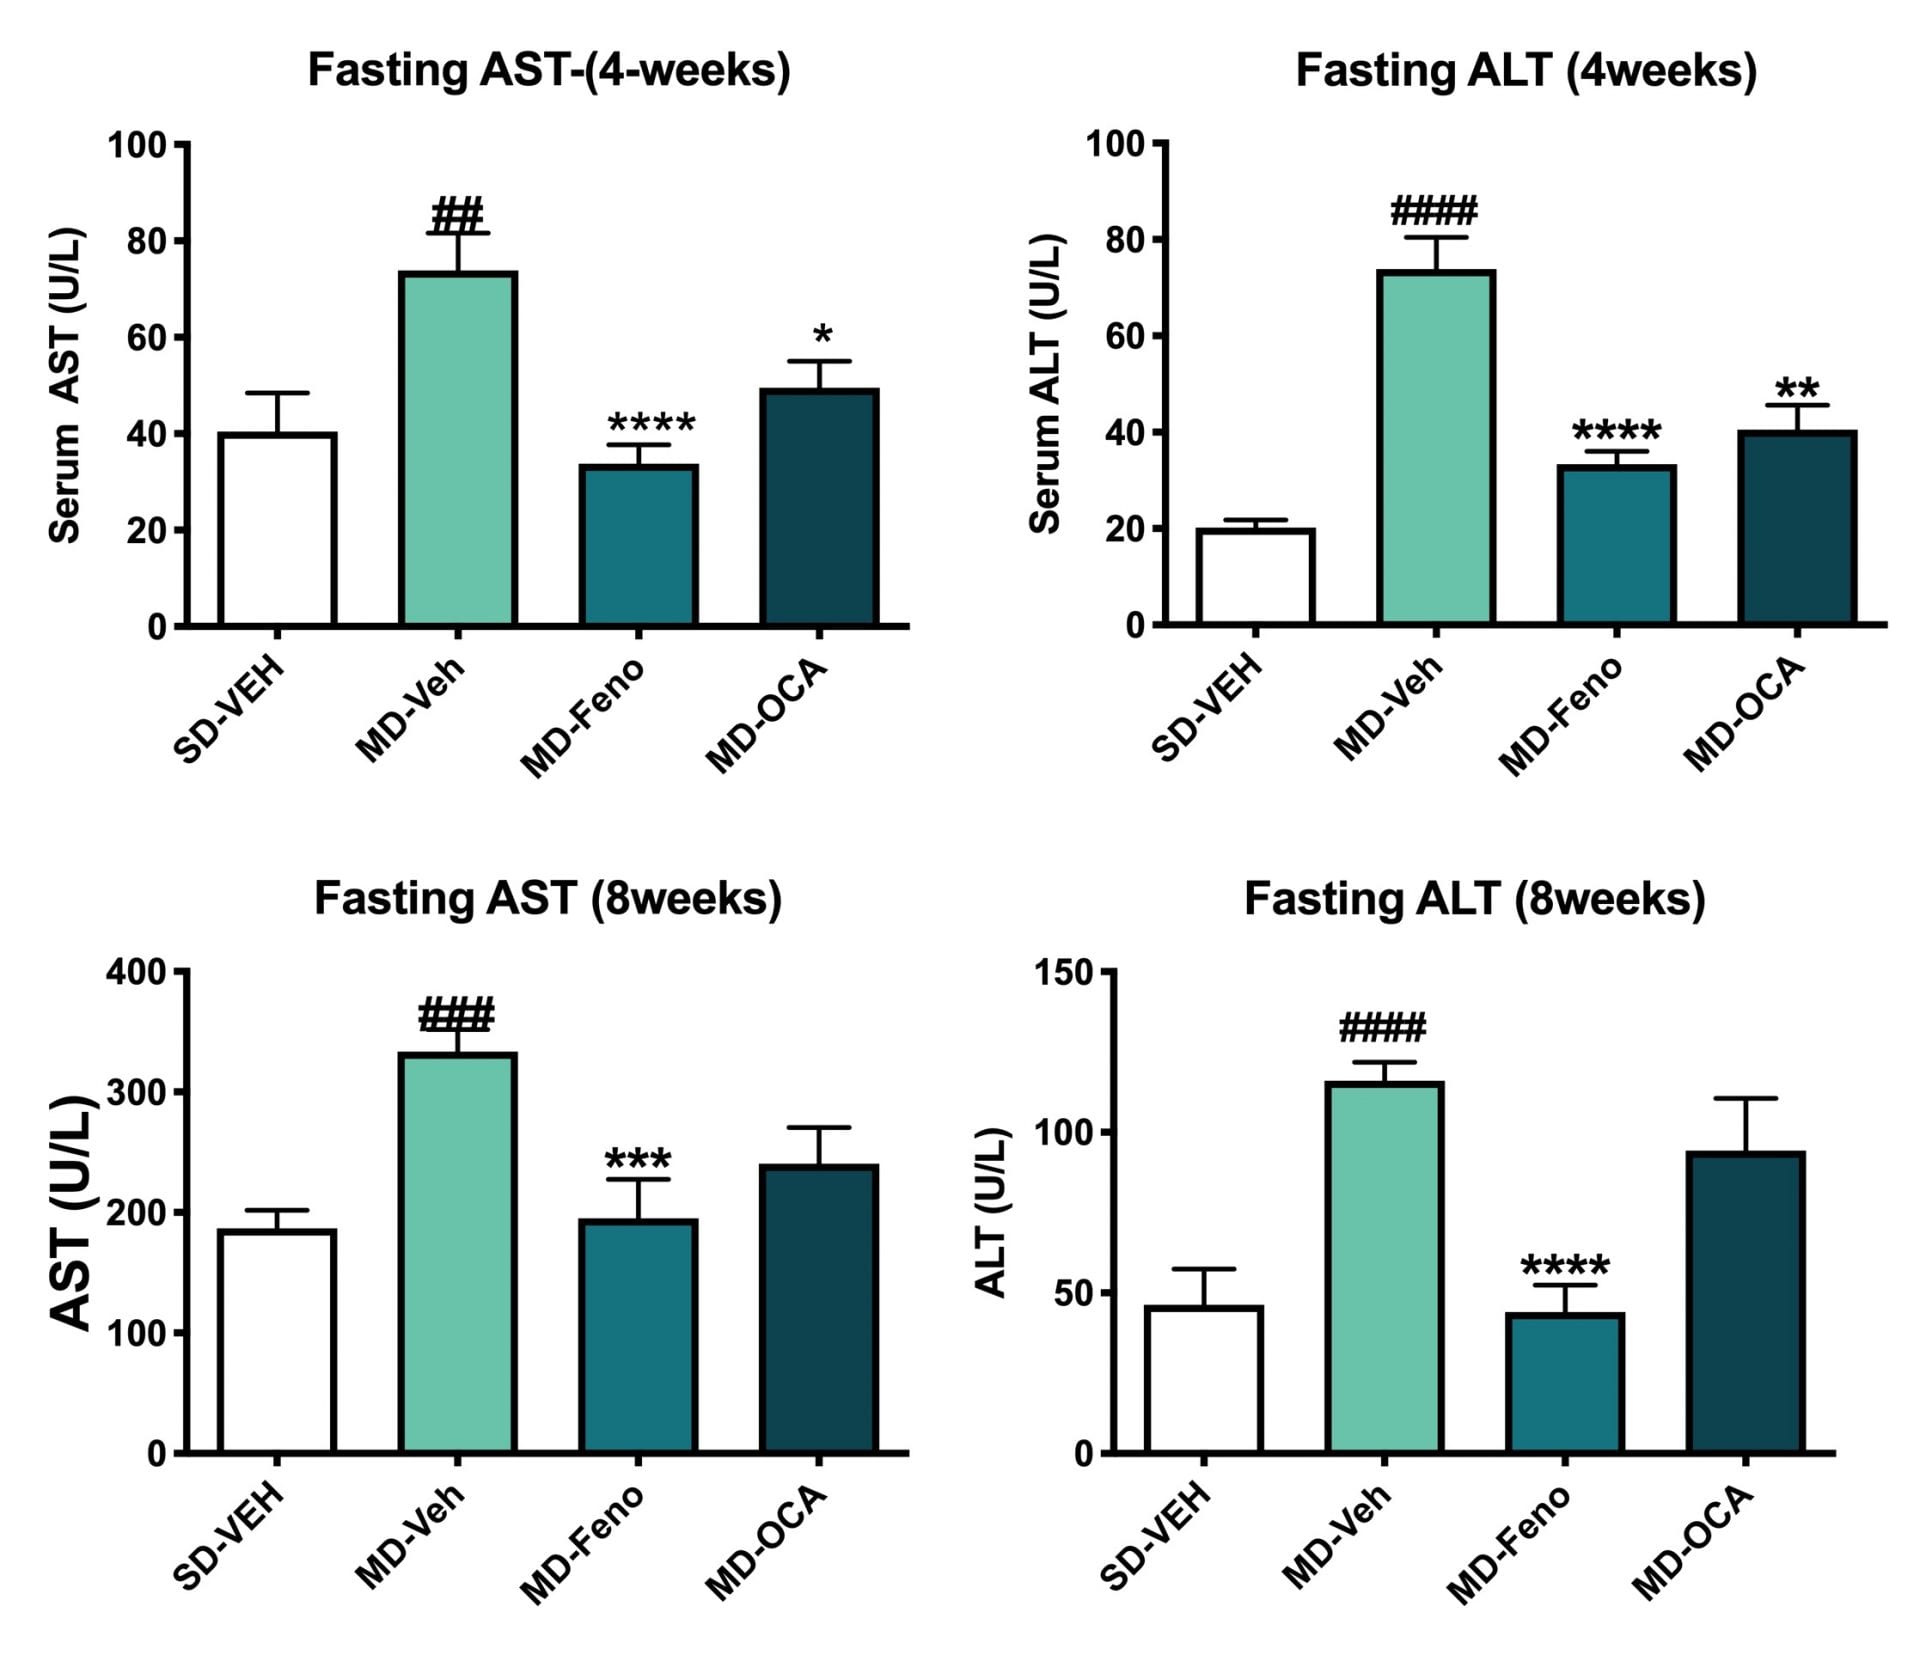
Fasting ALT and AST Level Changes. Fasting serum were also analyzed for ALT and AST levels at week 4 and week 8 of treatment. Compared to Normal chow-fed mice, MD- Vehicle mice demonstrated significant higher ALT and AST levels (at week4 and week8). Compared to MD-vehicle mice, Feno and OCA significantly reduced both ALT and AST levels at week 4. Compared to MD-vehicle mice, only fenofibrate significantly reduced both ALT and AST levels at week 8. Data are mean±SEM and analyzed by Unpaired T-tests as applicable (*p<0.05vs. MD-Vehicle; #### p<0.0001, vs. SD-Vehicle).
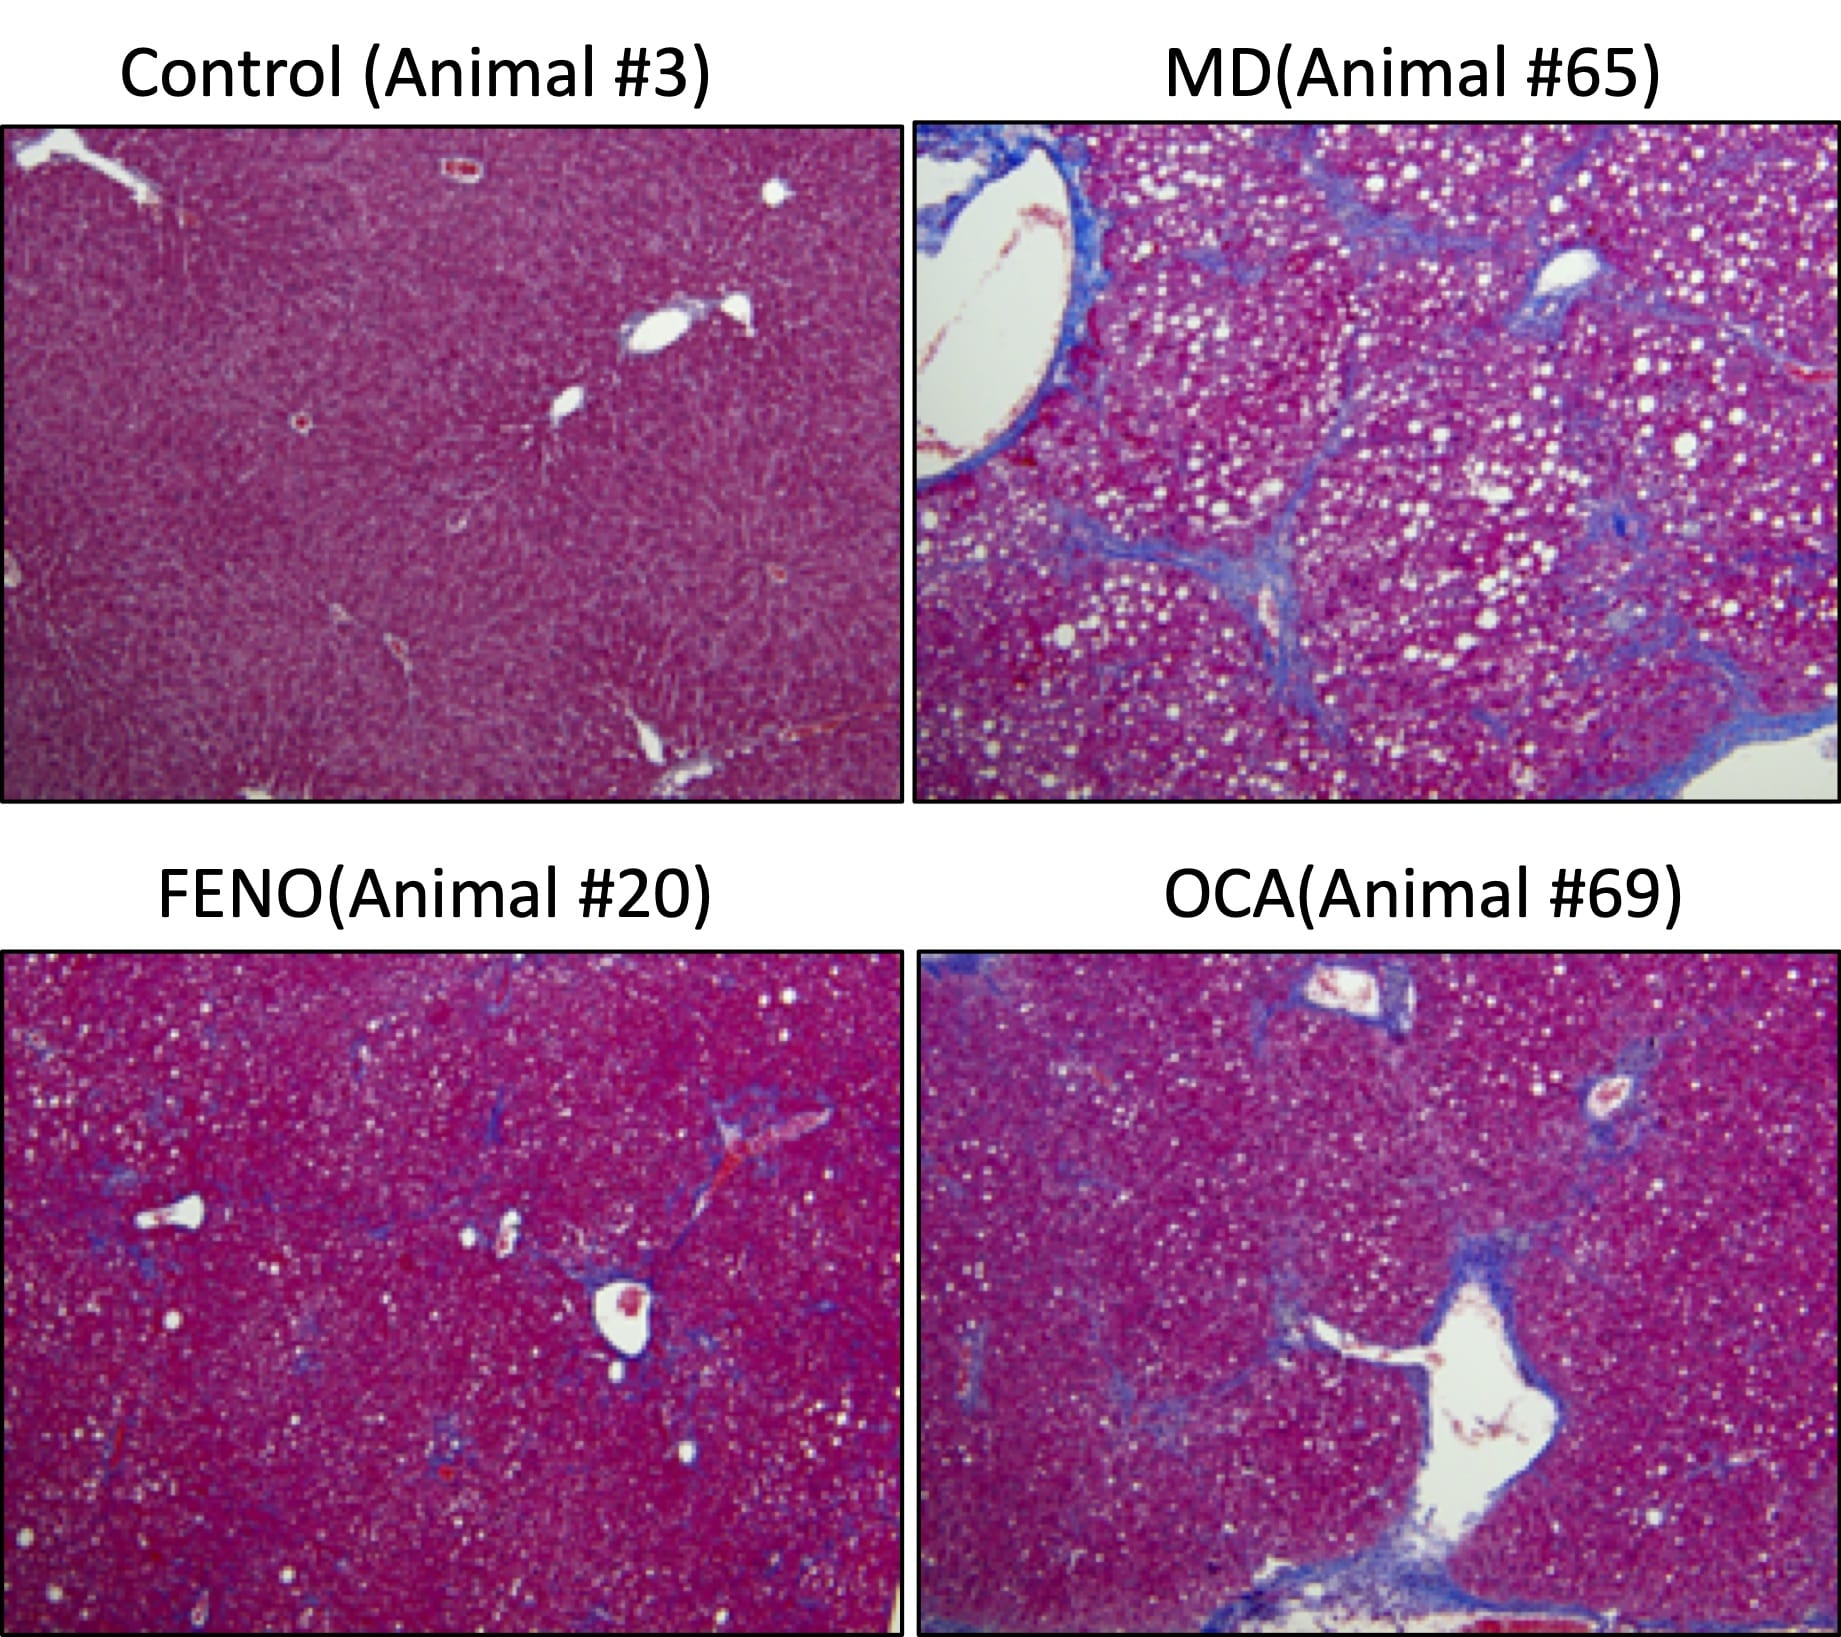
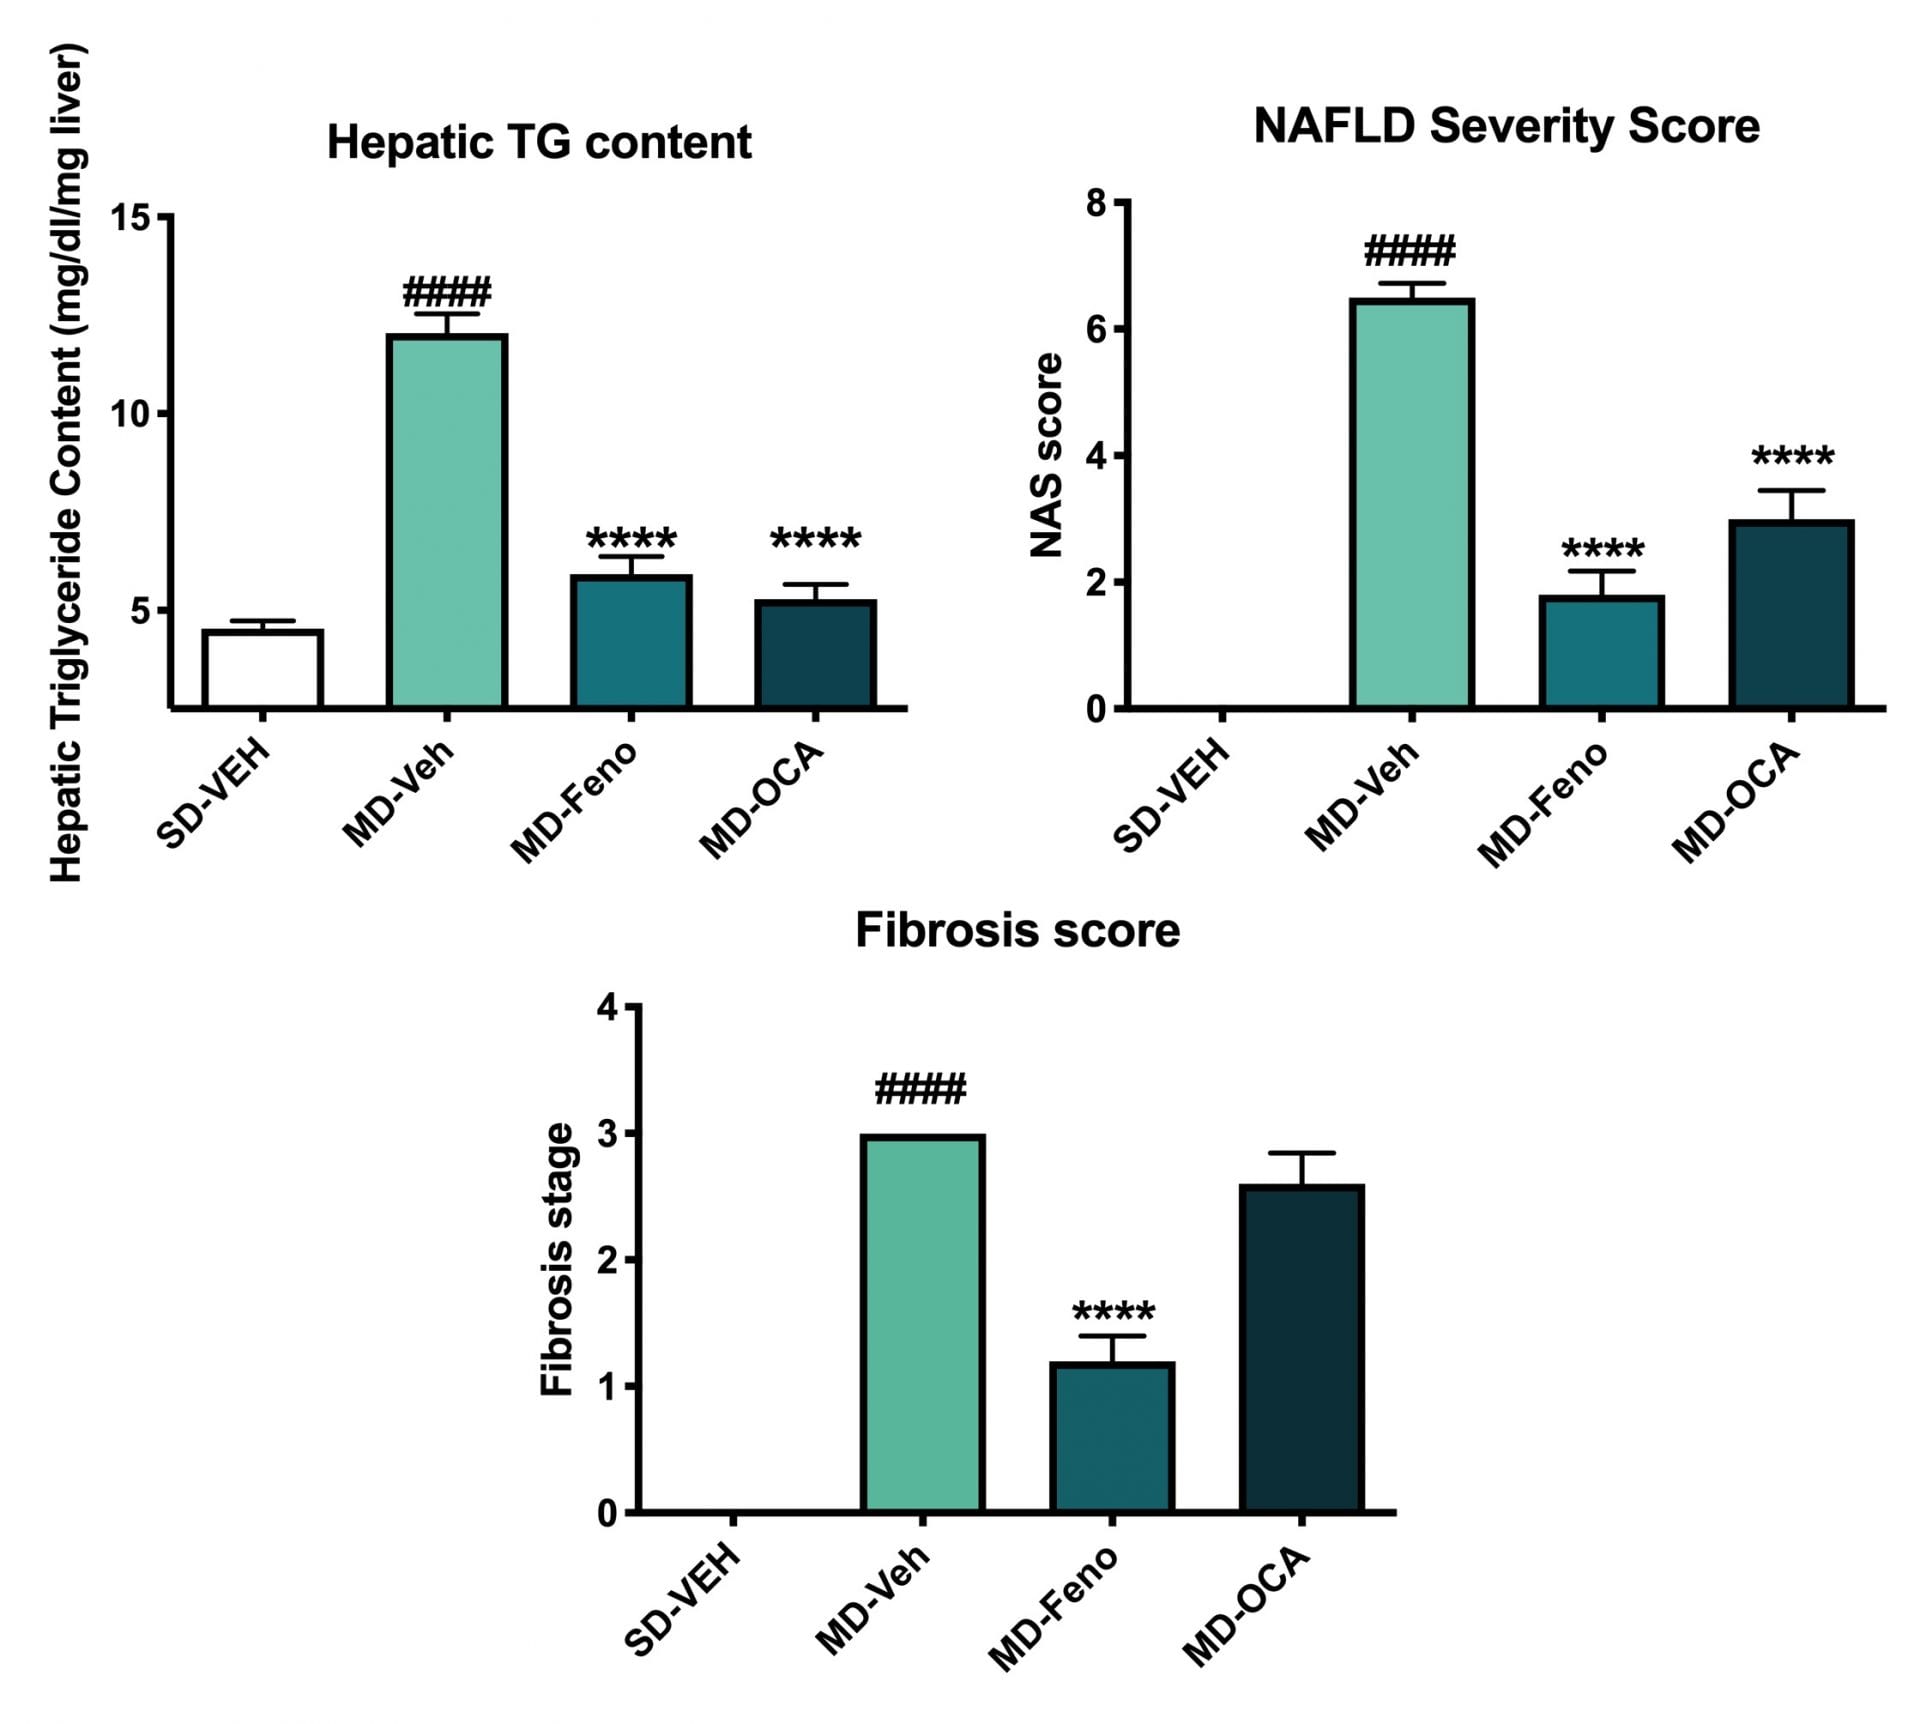
Hepatic TG and Histological Changes (NAS). At the end of the study, the liver tissues were collected for hepatic TG content analysis and histology assessment for NAFLD activity score (NAS; [5]) using with Masson’s Trichrome staining. Compared to Normal chow-fed mice, MD-fed Vehicle mice demonstrated significant higher TG deposition in liver. Compared to MD-vehicle mice, Fenofibrate and OCA significantly reduced the TG content in liver. Compared to Normal chow-fed mice, MD-fed Vehicle mice demonstrated significantly higher NAS score and stage 3 fibrosis. Although both Fenofibrate and OCA could profoundly improved NAS score, the significant amelioration of liver fibrosis was only observed in Fenofibrate-treated mice. Data are mean±SEM and analyzed by Unpaired T-tests as applicable. (*p<0.05,**p<0.01,***p<0.001****p<0.0001, vs. MD-Vehicle; #p<0.05, ###p<0.001,#### p<0.0001, vs. SD-Vehicle).
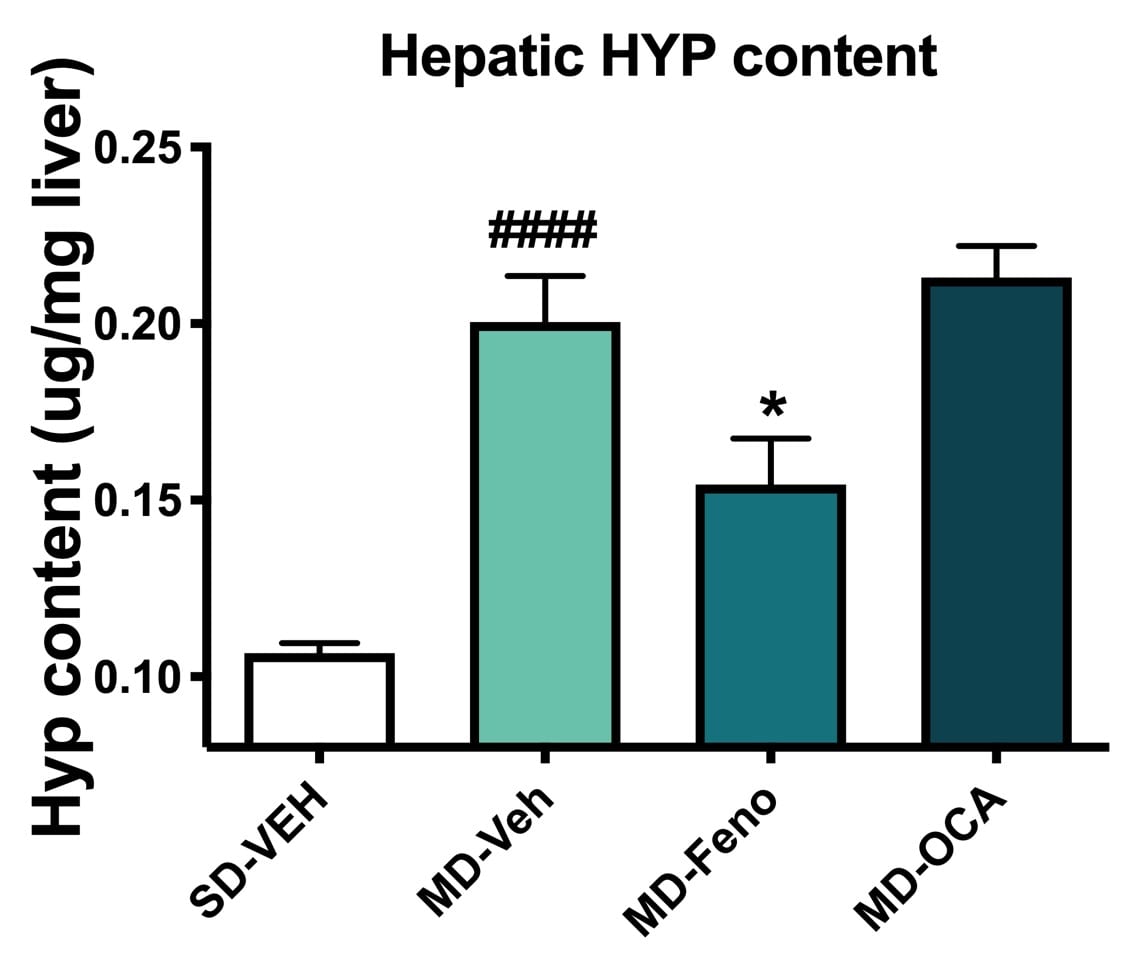
Liver Hydroxyproline Level Changes. Liver tissues were analyzed for hydroxyproline levels; a biomarker of fibrosis. Compared to Normal chow-fed mice, MD- Vehicle mice demonstrated significant HYP levels, indicating profound liver collagen deposition. Compared to MD-vehicle mice, consistent with the histology result, only Fenofibrate significantly reversed abnormal collagen deposition in liver in NASH model. Data are mean±SEM and analyzed by Unpaired T-tests as applicable (*p<0.05vs. MD-Vehicle;#### p<0.0001, vs. SD-Vehicle).
Conclusion
Based upon these results, we conclude that compared to Melior’s mHFD NASH model this mHFD & CCl4 model is similar with respect to metabolic aspects but exhibits higher severity of liver fibrosis comparable to clinical F3 stage. This NASH animal model is validated with OCA which is a compound that has been shown to show clinical efficacy towards NASH.
Reference
- https://www.niddk.nih.gov/health-information/liver-disease/nafld-nash/definition-facts
- Saito, K, et al. Characterization of hepatic lipid profiles in a mouse model with nonalchoholic steatohepatitis and subsequent fibrosis. Sci Rep. 2015: 5:12466
- Cong WN, Tao RY, Tian JY, Liu GT, Ye F. The establishment of a novel nonalcoholic steatohepatitis model accompanied with obesity and insulin resistance in mice. Life Sciences 2008; 82:983–990
- Tsuchida T,Lee YA, Fujiwara N, Ybanez M, Allen B, Martins S, Fiel MI, Goossens N, Chou HI, Hoshida Y, Friedman SL. A simple diet- and chemical-induced murine NASH model with rapid progression of steatohepatitis, fibrosis and liver cancer. J Hepatol. 2018 69(2):385-395.
- Kleiner DE, Brunt EM, Natta MV, Behling C, Contos MJ, et.al. Design and Validation of a Histological Scoring System for Nonalcoholic Fatty Liver Disease. Hepatology, 2005; 41:1313–1321
Frequently Asked Questions
The induction period for this MASH model typically requires 10+weeks. The treatment duration can vary from 2 weeks to 12 weeks.
This MASH model is featured with profound metabolic dysfunction, severe liver steatosis and severe fibrosis (F3-F4 clinical relevance).
 Interested in running the mHFD Model?
If you are interested in learning more about the mHFD Model, please contact us to start the conversation today!